Process control, golden batch analysis and soft sensors, applied to real process problems.
Portfolio
Featured case studies
Penicillin fermentation
Golden Batch Analysis for Penicillin Production
We compared 100 penicillin fermentation batches, split into high- and low-performing groups, to find what separates them. Most operating variables looked the same; PAA and substrate concentration did not.
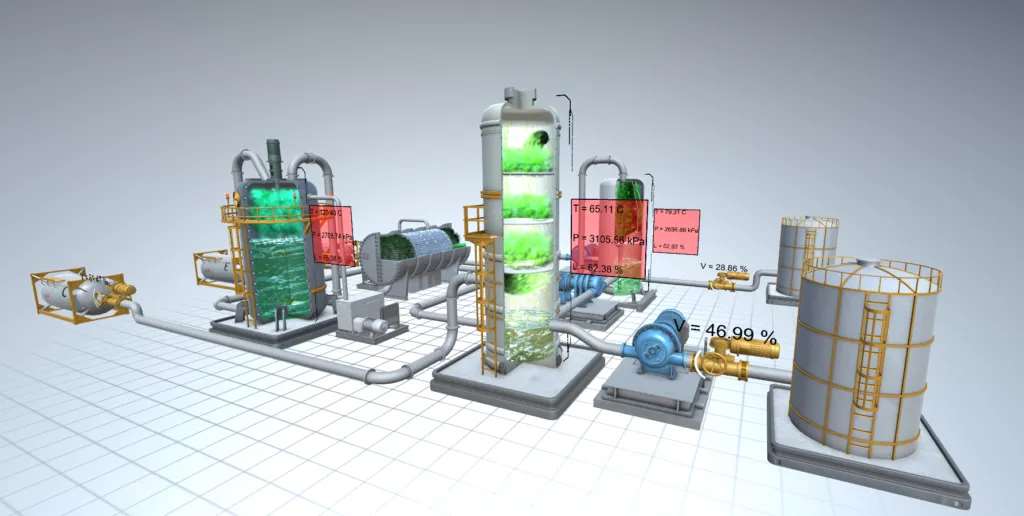
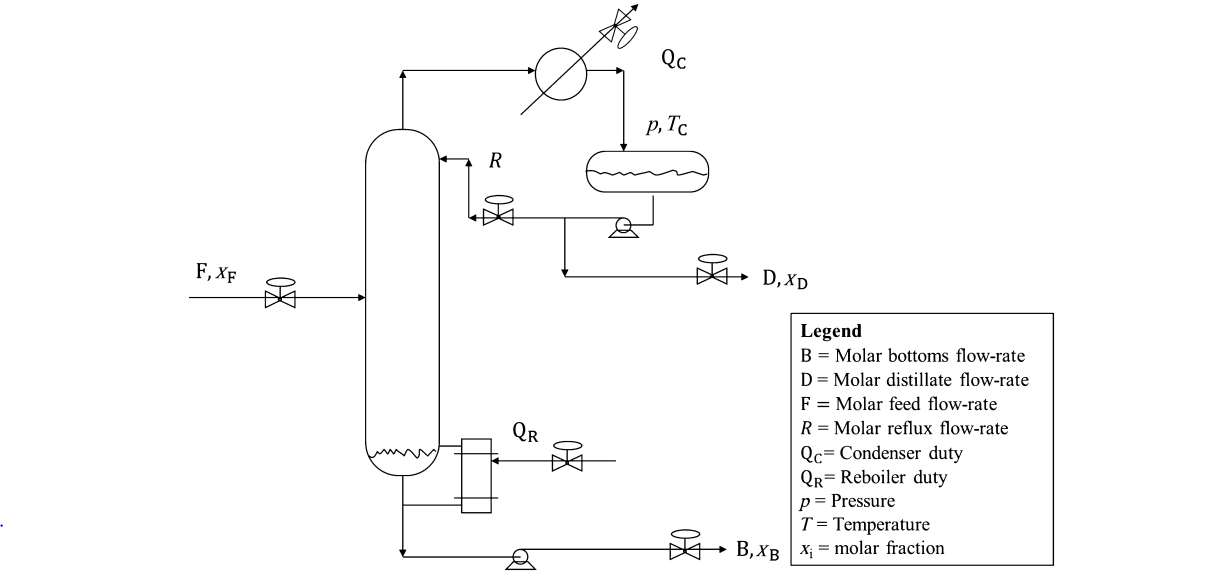
Plant-wide control on the Tennessee Eastman benchmark process. Equipment-wise control of a distillation column: reflux, distillate and bottoms flows with condenser and reboiler duty.
In pharmaceutical fermentation, a golden batch represents a batch that consistently achieves the desired product quality, yield, and process performance while operating within acceptable process limits.
Golden batch analysis involves comparing high-performing and low-performing batches to identify the operating conditions and process variables that contribute to successful production. The objective is to establish a benchmark operating profile that can be used to improve future batch performance and reduce process variability.
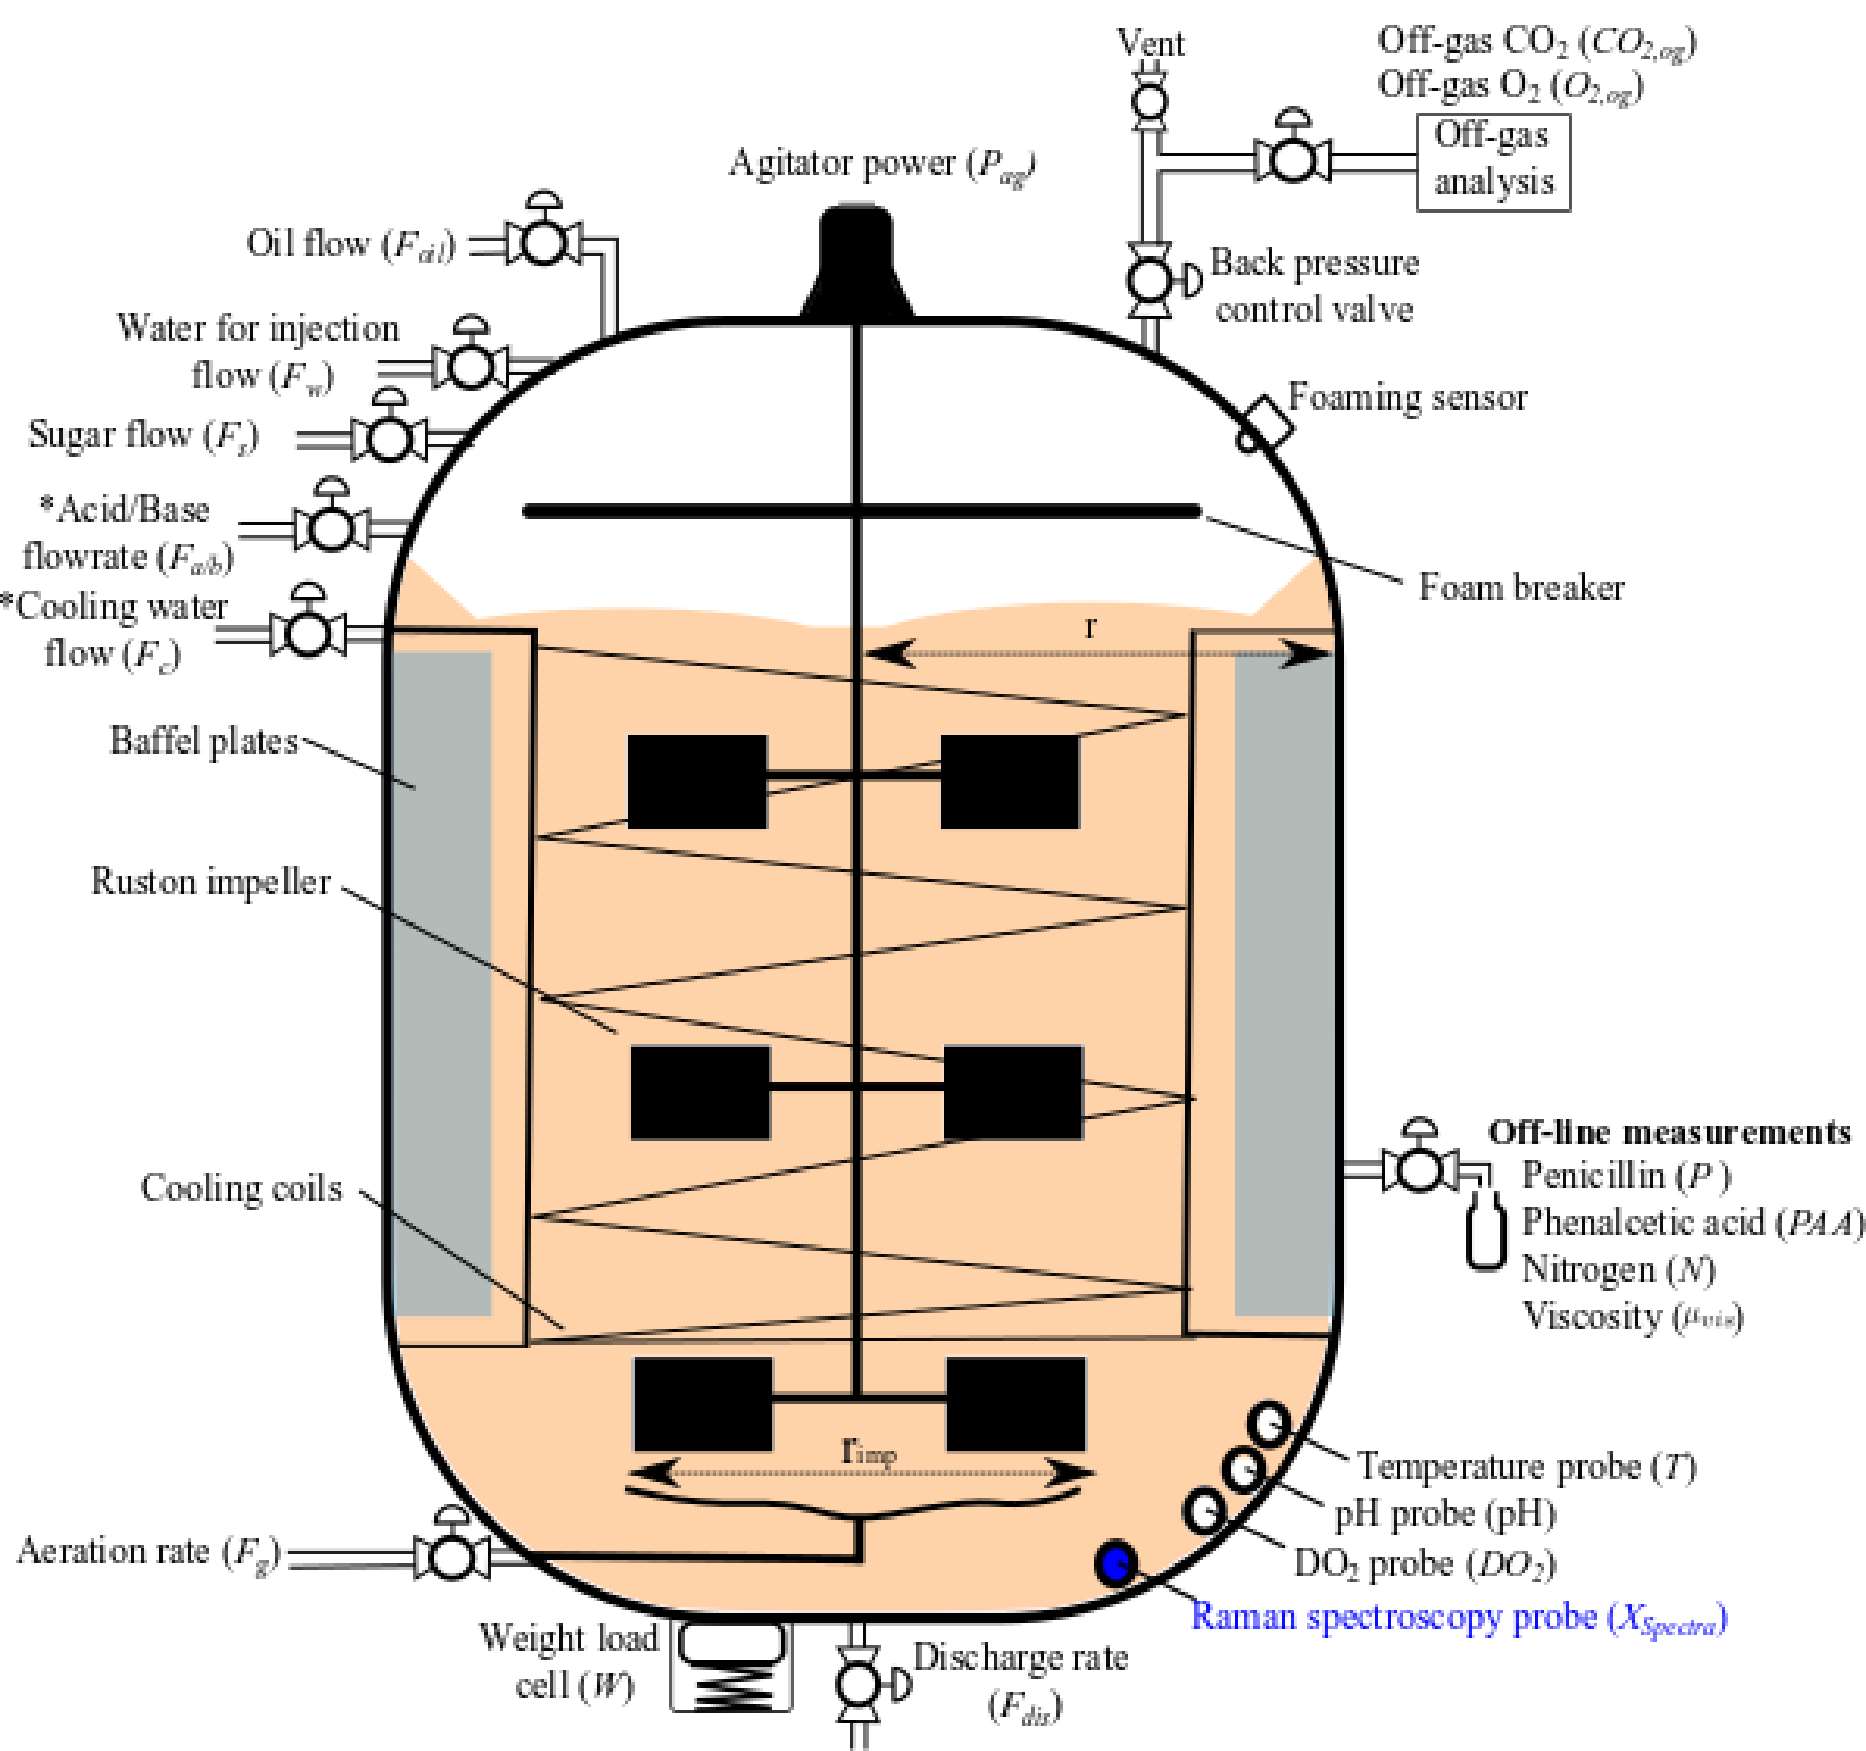
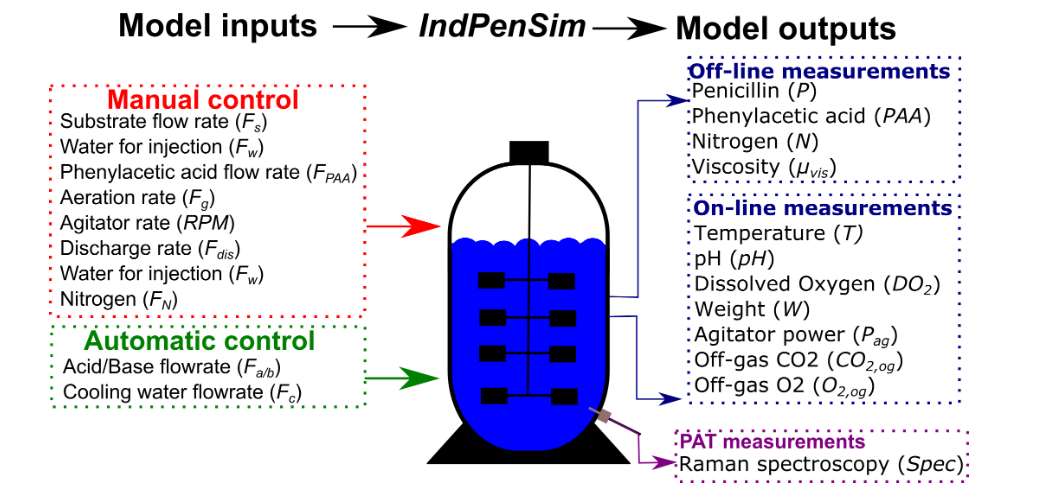
Fermenter schematic: manipulated flows, online probes and offline measurements.
Study approach
To understand the factors influencing penicillin production, historical data from 100 fermentation batches was analyzed. The batches were categorized into two groups:
Increasing penicillin batches (high-performing)
Decreasing penicillin batches (low-performing)
The distribution of key process variables was evaluated across both categories to identify conditions associated with favorable and unfavorable production trends.
Analysis of key variables
Variable
Increasing batches (avg.)
Decreasing batches (avg.)
Observation
Aeration rate
65.32 L/h
65.15 L/h
Nearly identical; not a differentiating factor.
Sugar feed rate
77.63 L/h
75.37 L/h
Similar averages; feeding was more stable in high performers.
Acid addition
0.01 L/h
0.15 L/h
Higher acid demand may indicate pH fluctuation and instability.
Base addition
69.91 L/h
49.95 L/h
Favorable pH conditions may support better performance.
Dissolved oxygen
12.38 mg/L
12.81 mg/L
No significant difference.
pH
6.49
6.50
pH control effective irrespective of outcome.
PAA concentration (offline, interpolated)
1259 mg/L
2725 mg/L
Excess precursor accumulation hurts performance.
Substrate concentration
0.1
9.4
Largest contrast; substrate build-up signals decline.
The variables that made the difference
PAA concentration
A significant difference was observed in the offline interpolated phenylacetic acid (PAA) concentration. The higher PAA concentrations in decreasing batches indicate that excessive precursor accumulation may negatively impact fermentation performance. This highlights PAA as one of the most influential process variables affecting penicillin production.
Substrate concentration
Substrate concentration showed the largest contrast between the two batch categories. Elevated substrate concentrations in low-performing batches suggest inefficient substrate utilization and potential metabolic limitations during fermentation. Substrate accumulation can serve as an early indicator of declining process performance.
Key findings
Most operating variables, including aeration rate, dissolved oxygen, pH and sugar feed rate, remained relatively similar across high-performing and low-performing batches. Conventional operating parameters alone are therefore insufficient to tell whether a batch will achieve optimal penicillin production.
In contrast, PAA concentration and substrate concentration showed significant differences and a much stronger relationship with fermentation performance and product formation.
Conclusion
PAA and substrate concentrations are key indicators of penicillin production performance. These findings highlight the need for real-time monitoring of critical process variables and support the development of soft sensors for improved fermentation control and batch consistency.
Batch pharmaceutical fermentation processes generate large volumes of operational data from DCS systems, historians, and laboratory testing. While variables such as temperature, pH, dissolved oxygen, feed rates, and vessel conditions are continuously available, many critical process variables remain measurable only through periodic laboratory analysis.
This measurement gap limits process visibility and delays corrective actions. Soft sensors address this challenge by converting available process data into real-time estimates of critical fermentation variables.
Available process measurements
Modern fermentation systems continuously monitor several important process variables:
Temperature
pH
Dissolved oxygen (DO)
Aeration rate
Agitator speed (RPM)
Air flow
Oxygen flow
Carbon dioxide concentration
Vessel volume
Vessel weight
These measurements provide valuable information about reactor operation and process conditions. However, the variables that directly determine fermentation performance are often measured offline:
Penicillin concentration
Phenylacetic acid (PAA) concentration
Nitrogen concentration
Viscosity
These are generally available only once every 12 hours through laboratory analysis. As a result, operators have limited visibility into the actual biological state of the fermentation.
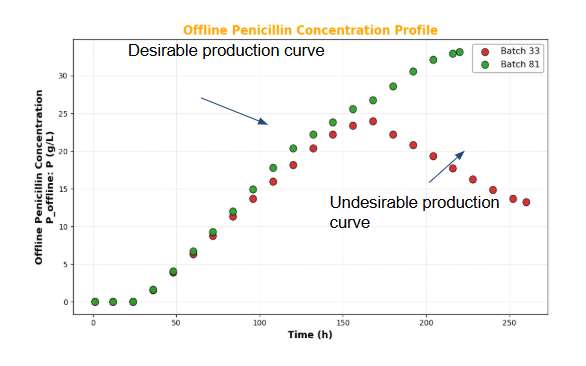
Offline penicillin concentration: a desirable (batch 81) and an undesirable (batch 33) production curve.
The need for soft sensors
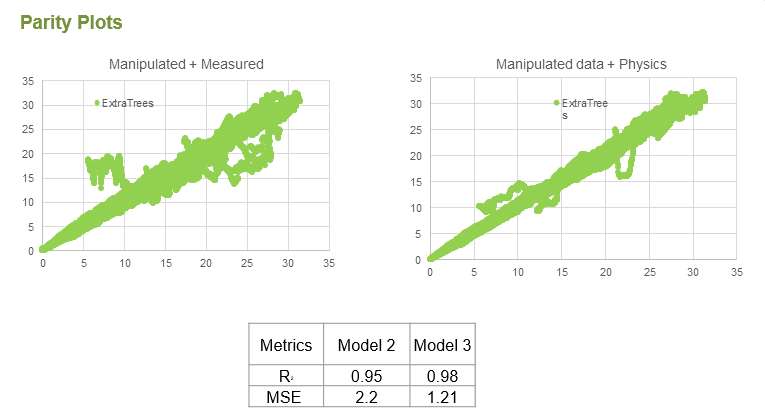
To evaluate the impact of process knowledge on prediction performance, two model configurations were built. Model 2 combined manipulated and measured process variables. Model 3 augmented these inputs with physics-derived variables, giving a more complete representation of the fermentation process.
Historical data from 100 penicillin fermentation batches was used for model development, split 80:20: 80% of batches for training and 20% held back for independent evaluation. Results on the test set:
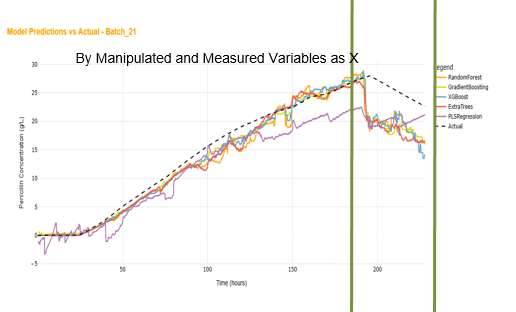
Parity plots on the test set: manipulated + measured (left) vs. manipulated + physics (right).Predictions vs. actual for batch 21 using manipulated and measured variables.
The model results show strong agreement with the experimental data for most of the batch, demonstrating that machine learning models can capture the overall process behavior. Towards the end of the batch, however, all models deviated increasingly from the experimental measurements.
This late-batch error is likely associated with complex biological dynamics such as substrate depletion, precursor limitations, and metabolic transitions that conventional process measurements do not fully represent. These findings motivated the inclusion of physics-derived variables to better characterize the fermentation state during the final production phase.
Why physics-based variables matter
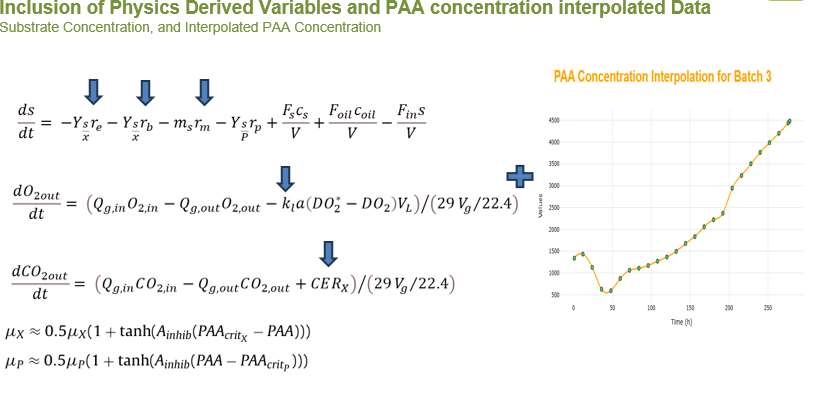
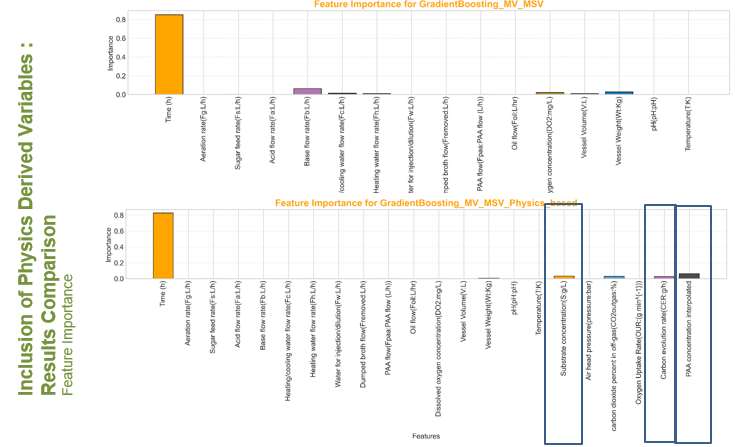
Feature importance analysis showed that process-derived variables contributed significantly to model performance. Key contributors included:
Substrate concentration
Carbon evolution rate (CER)
Off-gas oxygen concentration
PAA concentration
These variables represent the actual metabolic state of the fermentation rather than simply the operating conditions.
Physics-derived variables: substrate concentration and interpolated PAA concentration.
Key insight
Combining process knowledge with machine learning produces more robust soft sensors than relying on process data alone.
The case for a PAA soft sensor
The study identified PAA concentration as one of the most influential process variables. A dedicated PAA soft sensor could:
Estimate precursor concentration continuously
Reduce dependence on 12-hour laboratory measurements
Improve process visibility
Enable proactive feed adjustments
Support tighter process control
Instead of waiting for laboratory results, operators could access near real-time estimates of PAA concentration throughout the batch.
Operational benefits
Implementation of a PAA soft sensor can provide:
Real-time fermentation intelligence
Improved precursor utilization
Reduced batch variability
Faster response to process deviations
Improved penicillin yield potential
Reduced dependence on laboratory testing
A foundation for Advanced Process Control (APC)
Feature importance with and without physics-derived variables.
Conclusion
Hybrid soft sensors that combine operational data with physics-derived variables significantly outperform models based solely on process measurements. The results also highlight a strong opportunity for a dedicated PAA soft sensor that turns an infrequently measured laboratory parameter into a continuously available process variable.
For pharmaceutical manufacturers pursuing digitalization and advanced process control, soft sensors are a practical pathway to better process visibility, better decision-making, and better fermentation performance.